
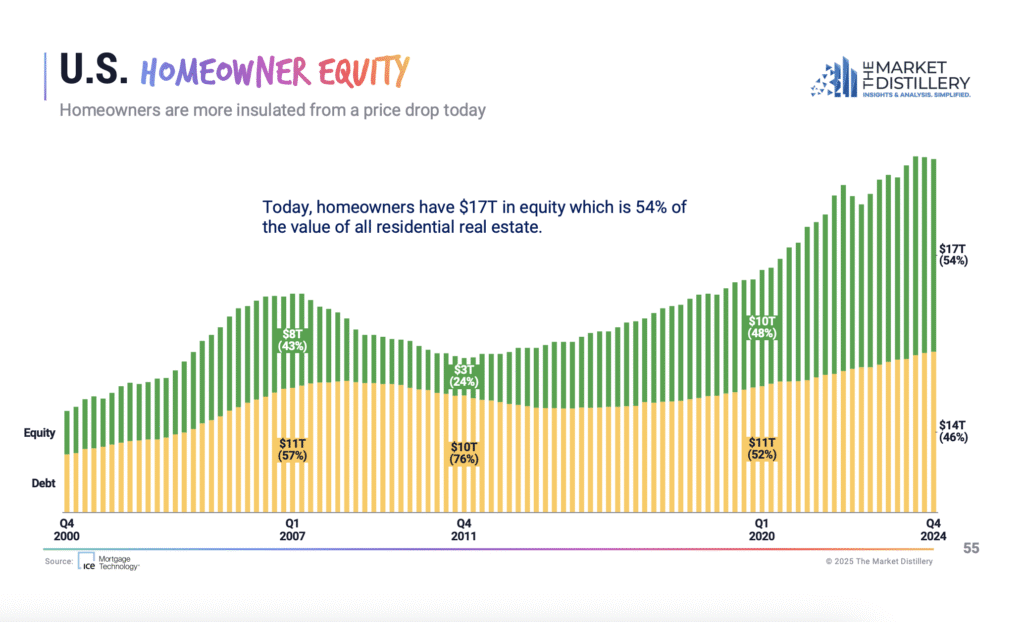
This chart breaks down how much equity U.S. homeowners have vs. how much debt they carry – and it tells a really interesting story about how things have changed over the last couple of decades.
Back in 2007, right before the crash, homeowners had around $8 trillion in equity, which sounds like a lot… but it only made up 43% of the total real estate value. Meanwhile, debt was much higher at $11 trillion (57%). That imbalance is one of the big reasons the market collapsed the way it did.
Then by 2011, things got even worse. Equity dropped to just $3 trillion, while debt stayed up around $10 trillion — meaning people only owned about 24% of their home’s value and owed the other 76%. A ton of homeowners were underwater.
Fast forward to Q4 2024, and it’s a totally different picture. Homeowners now have $17 trillion in equity, which makes up 54% of the total value of U.S. residential real estate. Debt is around $14 trillion, or 46%.
What does that mean? People are sitting on a lot more equity today than they were during the last crash — and that makes them way more insulated from a market downturn. Even if prices dipped a bit, most homeowners wouldn’t be in trouble.
The Locals Email About Everything St Augustine
Sent twice a week, this 5 minute email will give you all the insights on news, events and the real estate market

Are Homeowners under water?


The Locals Email About Everything St Augustine
Sent twice a week, this 5 minute email will give you all the insights on news, events and the real estate market
Real Estate Done Right
We love our customers, so feel free to visit during normal business hours.
Living in St Augustine
904-584-9263
trehberg8@gmail.com
Hours
Open today 09:00 am – 07:00 pm